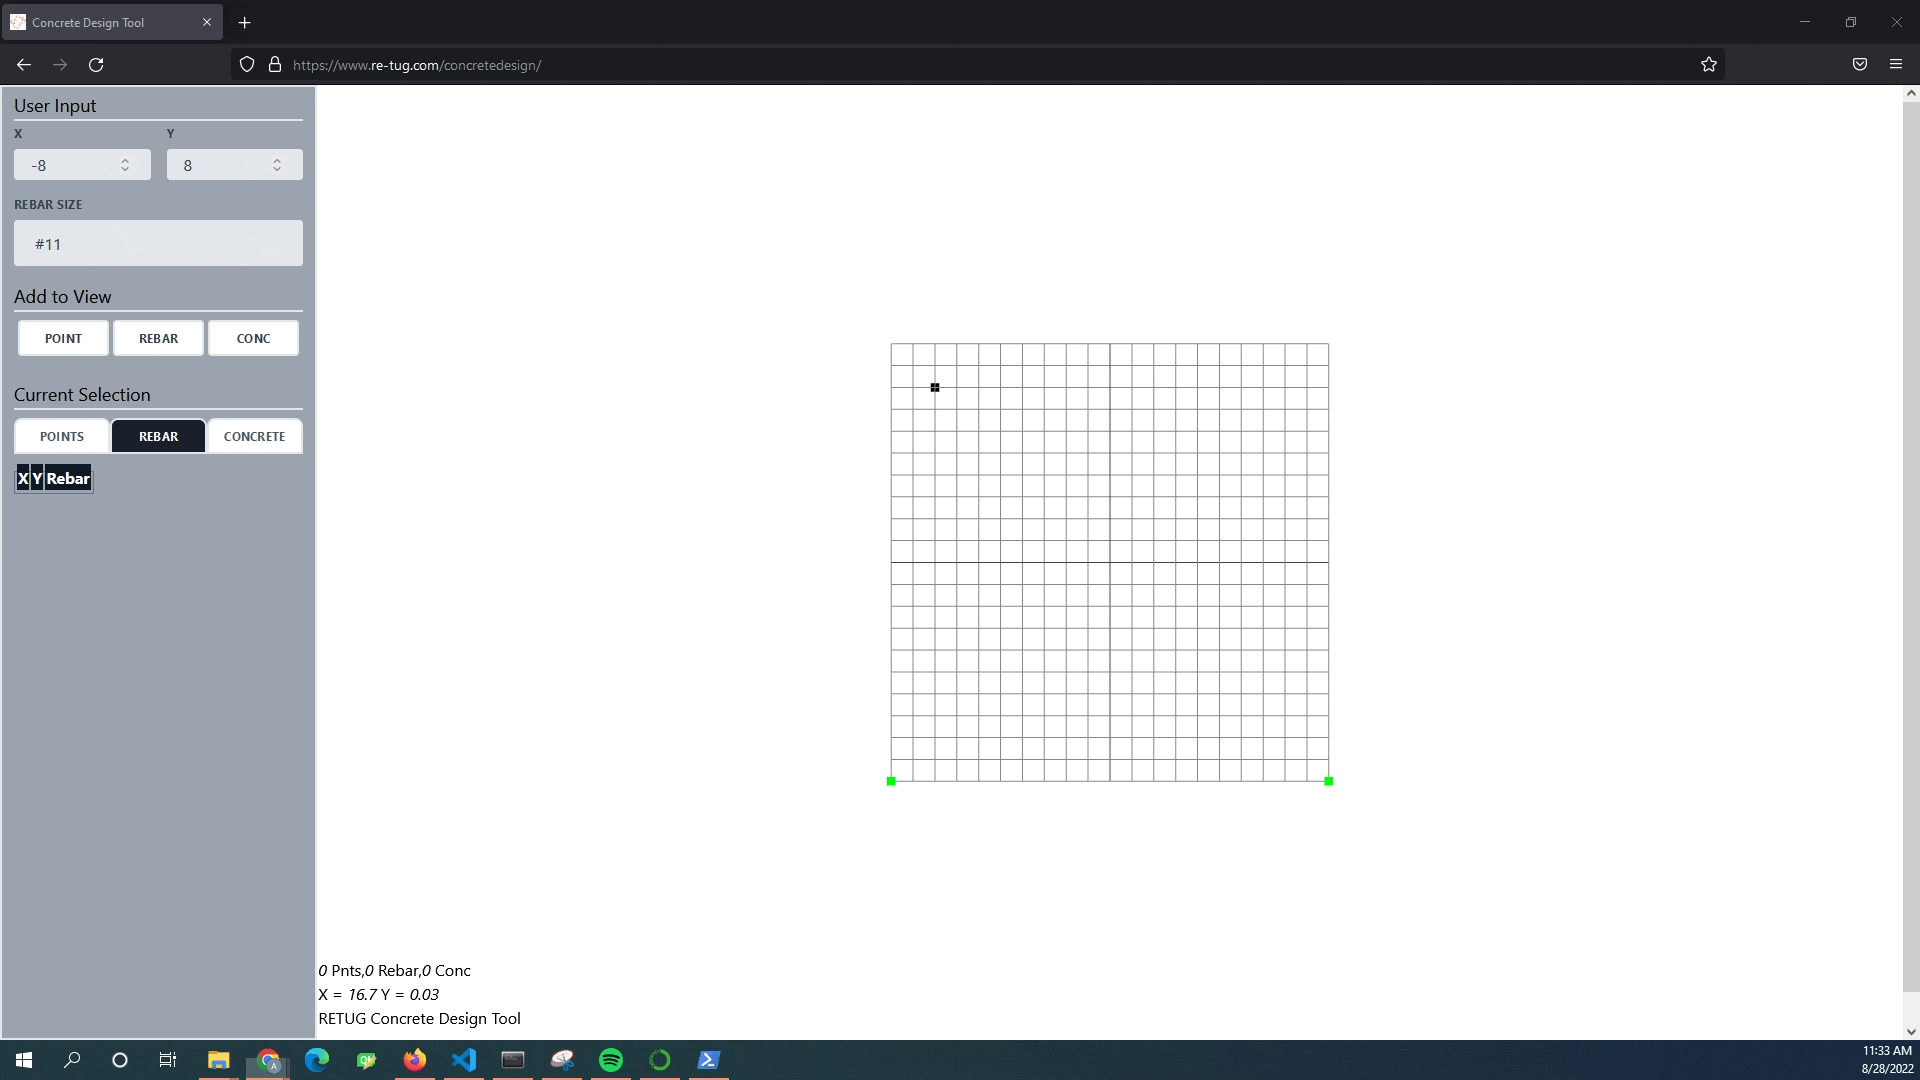
User Interface for Concrete Design Tool
After learning the basics of threejs for the about page, I set out to develop a web based concrete design tool. A video of https://www.re-tug.com/concretedesign/ in action is below:
The Functionality
I set out to make a easy to use interface that somewhat mimics the features of my favorite structural design software packages. One of the barriers to really awesome structural engineering packages like sectionproperties is that the end user needs to know a coding language. I have some python experience and it still usually takes me a good hour of reading documentation and examples to get section properties to do what I want it to do. I am hoping this user interface will remove the programming knowledge barrier.
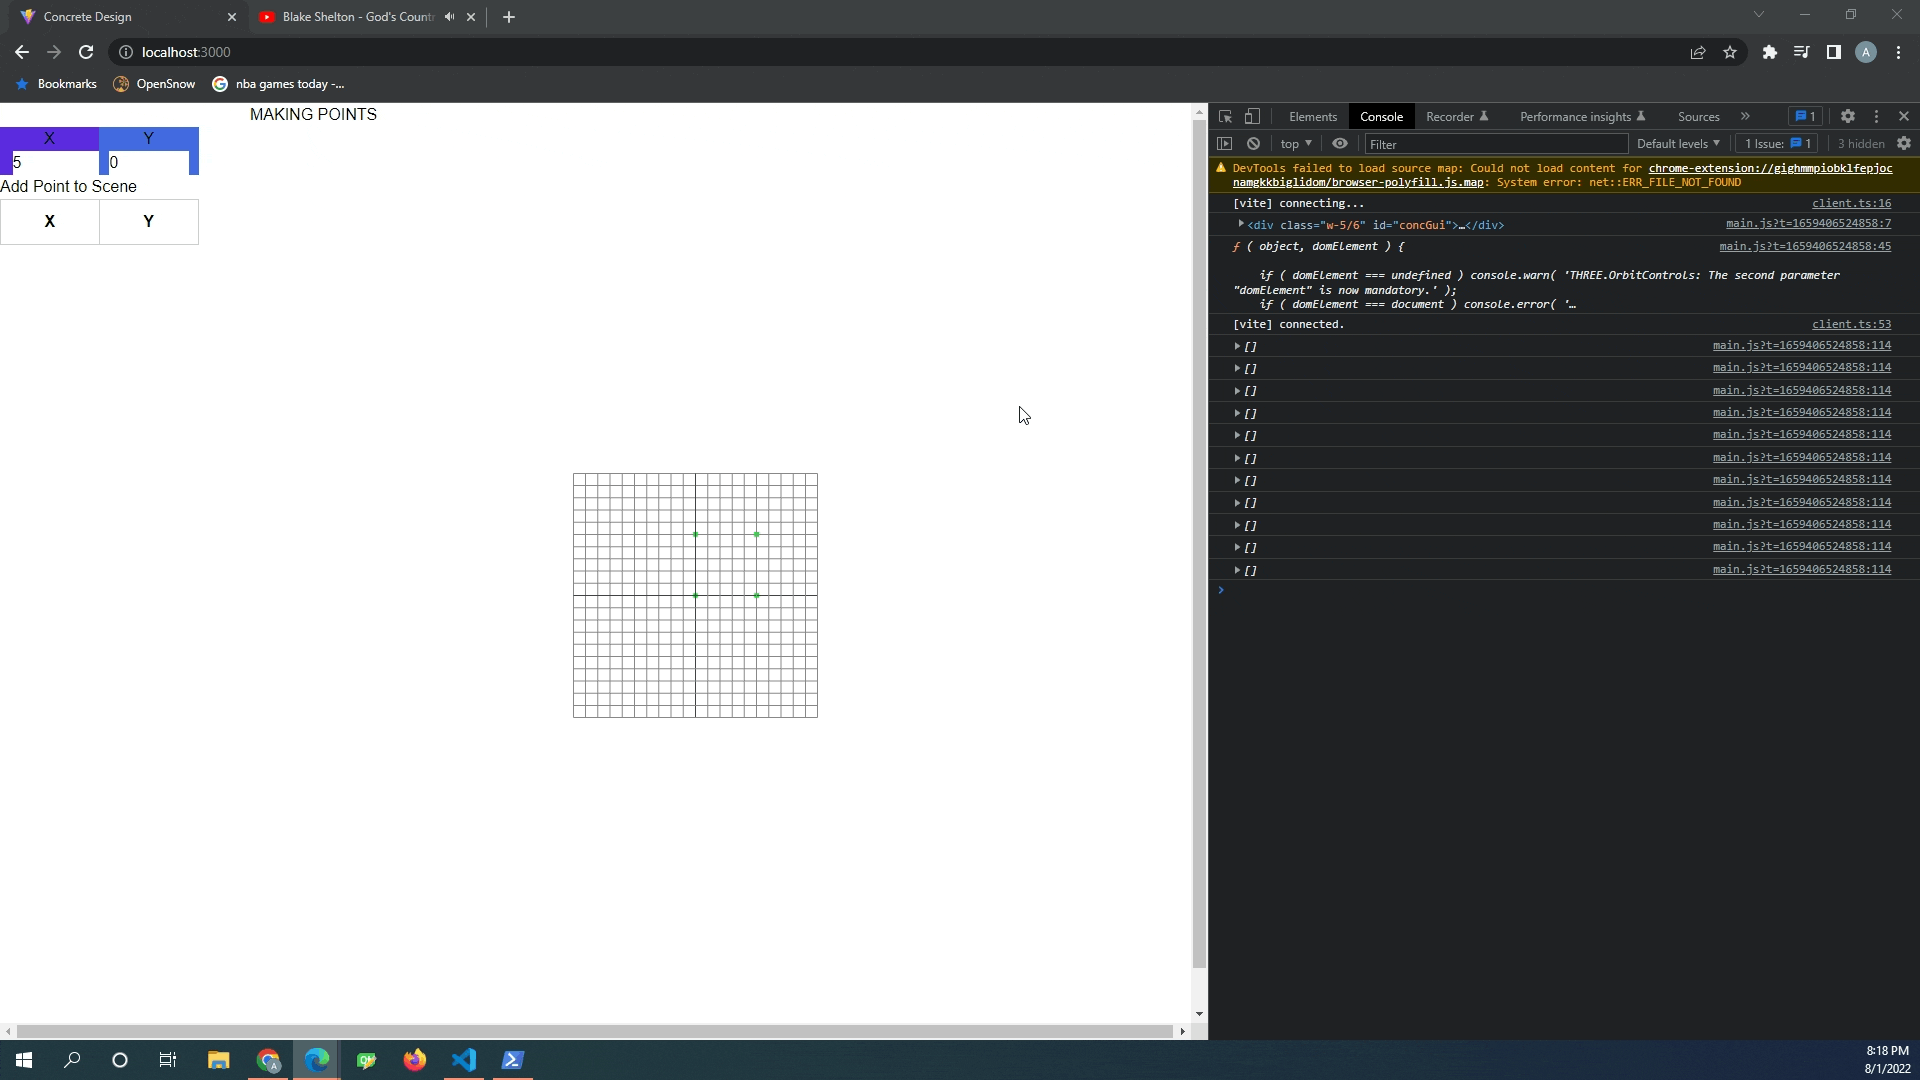
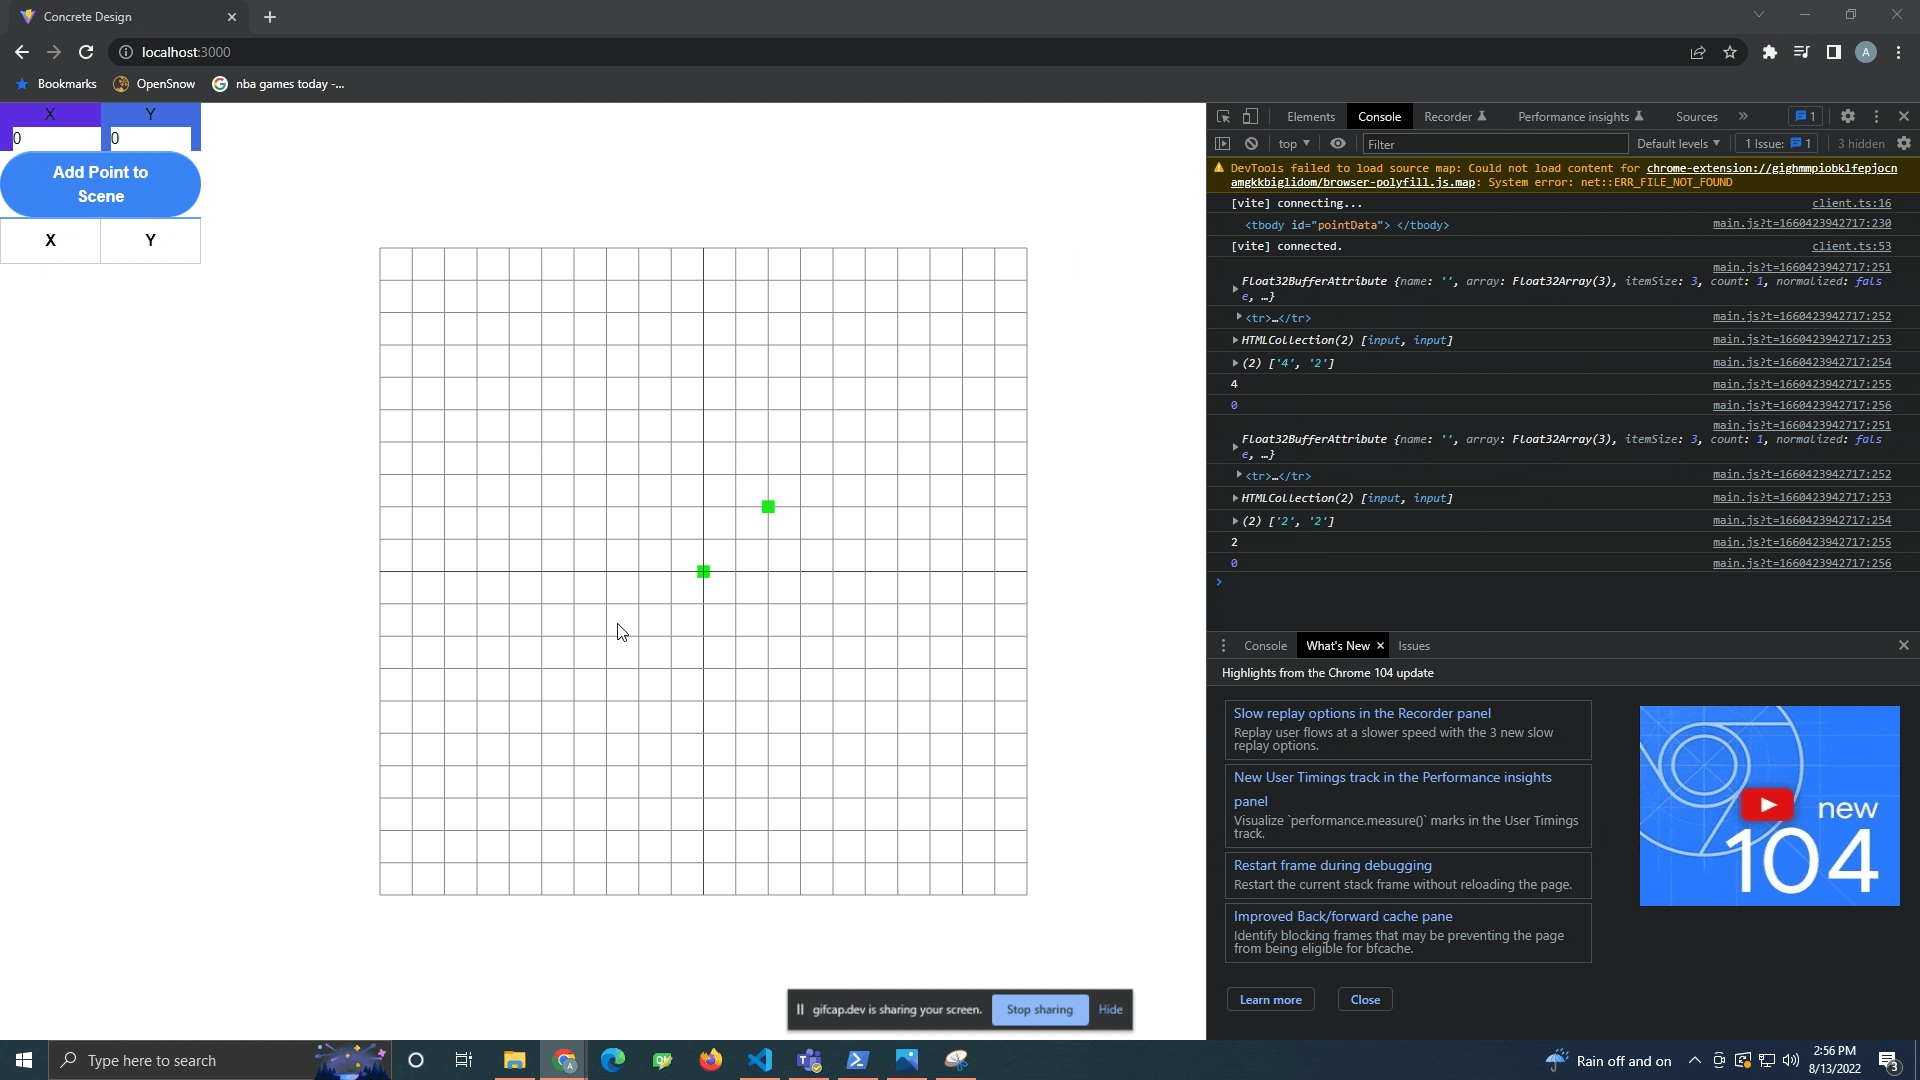
One feature that that I deemed mandatory was dynamic table feature. When inputting either rebar or points, I wanted to have a dynamically populated table that users could easily manipulate. The Current Selection tab of the user interface allows for modification of points and rebar dynamically. Other functions triggered by keyboard shortcuts
Keyboard Shortcuts
- Control
- Hold down control to add to your selections
- Shift + R
- This triggers the replicate function
- Enter an X and Y coordinate
- Delete
- Removes anything that is selected from the scene
- Mac users might be out of luck at the current moment, apparently there is no delete button on mac?
This graphic user interface will serve as the front end for the future concrete finite element tool that I hope to develop.
The Interesting Parts of the Code:
Code can be found on github. The javascript file at ~700 lines of code is definitely the largest file I have worked with in my coding experience. Navigating the code is super tedious! I need to go back through the code and add comments to help me better navigate and understand the code for when I come back to it.
Mouse Normalization
(If I misspeak here, please correct me in the comments below, my understanding of mouse coordinates are still quite fuzzy)
Three js sets up a scene with the 0,0 coordinates being centered in the canvas element of the webpage, while the html 0,0 coordinates are in the upper left hand portion of the webpage always and forever.
This creates some problems for my selection box, as it needs to be converted from the html coordinates to the three js coordinates. This is accomplished with the following code:
selectionBox.startPoint.set( ((event.clientX - (window.innerWidth*1/6)) /
concGui.offsetWidth)*2-1, - ( event.clientY / concGui.offsetHeight )*2+1, 0.5 );
The user selection area on the left hand side of the webpage set to take up exactly 1/6 of the webpage and after some console logging trial and error, the following mouse coordinate normalization allowed my selection box tool to accurately select objects in the scene.
In the lower left hand corner of 2d scene, I have added a mouse tracker. It accurately maps the 0,0 coordinate scene of the scene, but does not correctly capture the x and y coordinates of the 2d plane. I will need to update this in the future.
Making a new material for each point
When trying to implement a change of color if the point happened to fallen within the selection box, I thought that I could temporarily override the material property color. This did work, but had the adverse effect of changing all the points in the scene to the selected color.
This was solved by making a new material for each individual point.
Keybinds on Certain Aspects of the Webpage
My selection box event gets triggered by (3) differing events, the pointer down, pointer move and pointer up event. I needed these events to only trigger on the white space of the screen, but not on the dynamic table portion of the webpage. Initially I tried to solve this by checking if the mouse coordinates were on the left hand side of the page, but this was overly complicated.
In the gif below, you can see that I was console.logging my mouse x coordinates and the dynamic table kept resetting.
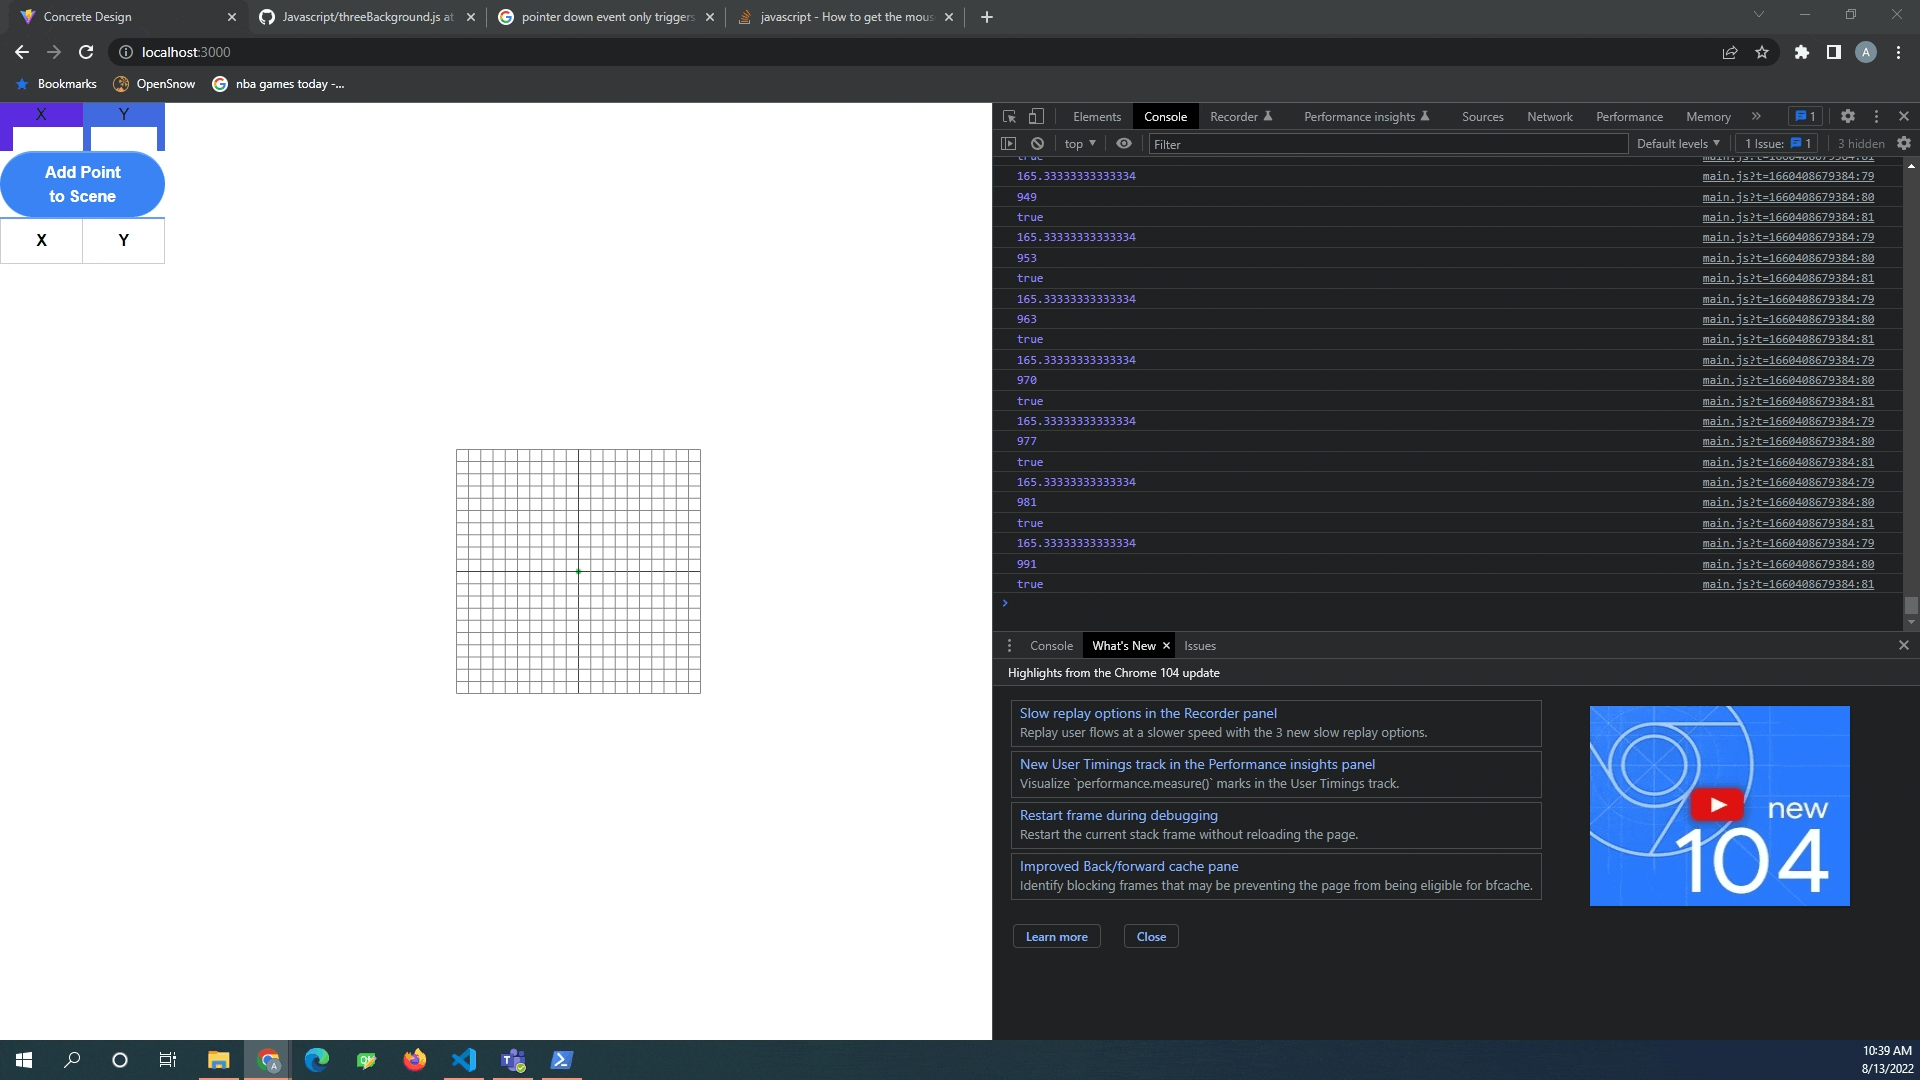
I was able to solve this problem by binding my pointer events to only the concrete gui object in the web browser. Now the pointer events only fire if they are on the white graphical user interface portion of the webpage. Sample code:
document.getElementById('concGui').addEventListener( 'pointerdown', function ( event ) {

  if (event.ctrlKey) {...
Selection Box Troubles
The dynamic table updating caused a lot of problems for the selection box tool. The code was able to visually update the "scene", but the selection box was not registering the updated position.
This was solved by deleting the old point in the scene and then recreating the updated point. I still do not know why updating the location in three js does not work, I have an unanswered question out on their forum that I hope someone will answer.
Notes on Deployment
Deployment was much nicer this go around. I am so thankful that I did not have to go through deployment hell like last time on my about page. There were still troubles, but I had already learned the important aspects of webpack and node to solve these troubles.
Webpack Development Mode vs Production Mode
When I ran webpack on the main.js file, I was surprised to see I was getting a console log error. If you remember from my last post, webpack will take your readable javascript code and covert into a single massive line of code that is optimized for web performance. Trying to debug this code is damn near impossible. I was left with a console log error of:
Uncaught DOMException: Failed to execute 'add' on 'DOMTokenList': The token provided
('[object Object]') contains HTML space characters, which are not valid in tokens.
at new <anonymous> (.../main.js:2:470798) at .../main.js:2:470705 at
.../main.js:2:485232
I was able to piece together that the error was occurring on the second line, at character 470798, the code around this area looked like the following:
(t,e.children[n])}}(bo,yo),Do=new class{constructor(t,e)
{this.element=document.createElement("div"),this.element.classList.add(e),
this.element.style.pointerEvents="none",
These areas of the code are created by webpacks optimizations and I could not pinpoint the part of my code that was causing the web problems.
Switching the webpack.config.js settings of mode: 'production" to mode: "development" leads to a less optimized javascript file, but allows for better error messages in your console.
webpack.config.js
const path = require("path");

module.exports ={
    mode: 'production', (switch to development)
    entry: "./src/concgui.js",
    output: {
        filename: 'static/concgui/[name].js',
        path: path.join(__dirname, 'blog')
      },
}
Unfortunately, I did not take a picture of the new error message, but the console log error was quite specific to a portion of the code that I had made an error in and I was able to resolve the error quite quickly. I switched the mode back to production for deployment and the file size is about 1/2 the development mode.
Webpack For Tailwind CSS
TailwindCSS provides the nice styling for the user interface. I reached out to Celt for this one as I was struggling to get tailwindCSS incorporated in the webpage and I know Celt used bootstrap (another styling CSS package) on his local server to style up his website. I could not find an easy way to download tailwind CSS directly, so I ended up using webpack again to serve up all of the styles in used in the html to a css file. I also have to thank celt for his website examples, I did lots of snooping and inspecting. I replicated the <select> html code for the rebar drop down menu.
It did take some tinkering on my config.js file to get the tailwindcss to work, but after adding an entry point to config file, all worked well and a .css file that only contains the styles utilized on the webpage popped out from the webpack run.
Sample from the Config.js File:
/** @type {import('tailwindcss').Config} */
module.exports = {
  content: ["./src/conc_gui.html"],
  entry: "./src/conc_gui.html",
  theme: {
    extend: {},
  },
  plugins: [],
}
Future Work
Meshing Algorithm
The next big step for this webpage is to implement a meshing algorithm. This is where I need your help! Let me know if you have any good ideas on the best way to move forward on setting up a meshing algorithm.
Options that come to my mind:
- Triangle - Currently used in section properties I believe
- Gmsh - This was recommended to me by an engineer at my office. I do not know much about this, but it looks promising.
- Threejs - Threejs meshes things, but I am not sure if it is optimized for finite element type analysis? More research to be done
- EDIT: Delaunator javascript package looks promising
- Edit: Poly2Tri
- Insert your opinion here
- Make my own?
Materials
I also want to add a way to input concrete and rebar stress strain material curves. Moving forward, I will just test with 4000psi concrete and 60ksi rebar stress strain curves, but in the future I want this be a user input.
Dynamic Popup Forms
My current replicate function uses (2) alert popups to prompt the user for x and y values. It would be nice to have a single form pop up. I know this can be done, but may require another javascript package to accomplish. Leave a comment if you have any suggestions on dynamic popup forms in javascript.
Resolve Dead Page
The page is currently a dead page, aka, there is no top bar to get back to the main website. I will have to update this in the future. Unfortunately, this means I will also have to revisit my mouse normalization portion of the code as well.
Updating the mouse coordinates to match the scene
The x and y coordinates currently output into the document are not correct. I need to explore mouse normalize and the raycaster function of threejs to update this I believe.
Please take the user interface for a spin, let me know any areas where it could be improved or any bugs you may encounter!